

Bridge online health monitoring system
1.System Overview
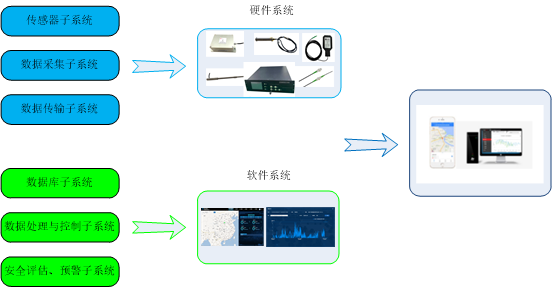
Figure 1.1 Topology diagram of online monitoring system
The system consists of a perception layer, a transmission layer, and an application layer, specifically consisting of a sensor subsystem, a data acquisition subsystem, a data transmission subsystem, a database subsystem, a data processing and control subsystem, a security evaluation and early warning subsystem. Through mutual coordination among various layers, the corresponding functions of the system are achieved.
2.Main monitoring content
| Monitoring category | Monitoring content | Monitoring Options | |
| Environment | Temperature and humidity | Environmental temperature and humidity a in the bridge site area |
● |
| Temperature and humidity inside the main beam |
● |
||
| Temperature and humidity inside the main cable |
○ |
||
| Temperature and humidity inside the anchor chamber b |
● |
||
| Temperature and humidity inside the saddle cover |
● |
||
| Temperature and humidity inside the tower |
○ |
||
| Freeze | Bridge deck icing, main cable icing |
◎ |
|
| Role | Vehicle load | Vehicle weight, axle weight, number of axles, and vehicle speed in all lanes |
● |
| Traffic volume in all lanes |
● |
||
| Video images of vehicle spatial distribution in all lanes |
◎ |
||
| Wind speed and direction | Bridge deck wind speed and direction |
● |
|
| Tower top wind speed and direction |
● |
||
| Wind presssure | Main beam wind pressure |
◎ |
|
| Structure temperature | Temperature of concrete or steel structural components |
● |
|
| Temperature of bridge deck pavement layer |
○ |
||
| Ship collision | Pier acceleration |
○ |
|
| Video image |
○ |
||
| Earthquake | Ground acceleration on the bridge bank |
◎ |
|
| Acceleration at the top of the bearing platform or at the bottom of the bridge pier (Seismic fortification intensity of VII or above) |
● |
||
| Acceleration at the top of the bearing platform or at the bottom of the bridge pier (Seismic fortification intensity is VII or below) |
○ |
||
| Structural response | Displacement | Vertical displacement of main beam |
● |
| Lateral displacement of main beam |
● |
||
| Support displacement |
● |
||
| Longitudinal displacement of beam end |
● |
||
| Tower top deviation |
● |
||
| Main cable deviation |
○ |
||
| Corner | Tower top corner |
◎ |
|
| Horizontal corner of beam end |
● |
||
| Vertical corner at beam end |
● |
||
| Strain | Key section strain of the main beam |
● |
|
| Strain of critical section of cable tower |
○ |
||
| Cable force | Sling force |
● |
|
| Anchor span cable strand force |
● |
||
| Support reaction force | Support reaction force |
○ |
|
| vibrate |
Vertical vibration acceleration of main beam |
● |
|
| Lateral vibration acceleration of main beam |
● |
||
| Longitudinal vibration acceleration of main beam |
○ |
||
| Horizontal bidirectional vibration acceleration of tower top |
● |
||
| Sling vibration acceleration |
● |
||
| Structural changes | Foundation erosion | Foundation scouring depth |
◎ |
| Displacement | Anchor displacement |
● |
|
| Crack | Cracks in concrete structures |
○ |
|
| Steel structure cracks |
○ |
||
| Corrosion | Chloride ion concentration in pier body and cushion cap concrete |
◎ |
|
| Depth of chloride ion erosion in pier body and cushion cap concrete |
◎ |
||
| Broken wire | Broken wire of sling and main cable |
○ |
|
| Bolt status | Cable clamp screw tightening force, high-strength bolt tightening force, bolt slipping |
○ |
|
| Cable clamp slip | Cable clamp slip |
○ |
|
|
Pour:●Selected monitoring items,○Choosing monitoring items is advisable,◎Is an optional monitoring item。 |
|||
| A only applies to closed box girders. B Only applicable to ground anchored suspension bridge. |
|||
3.Monitoring diagram
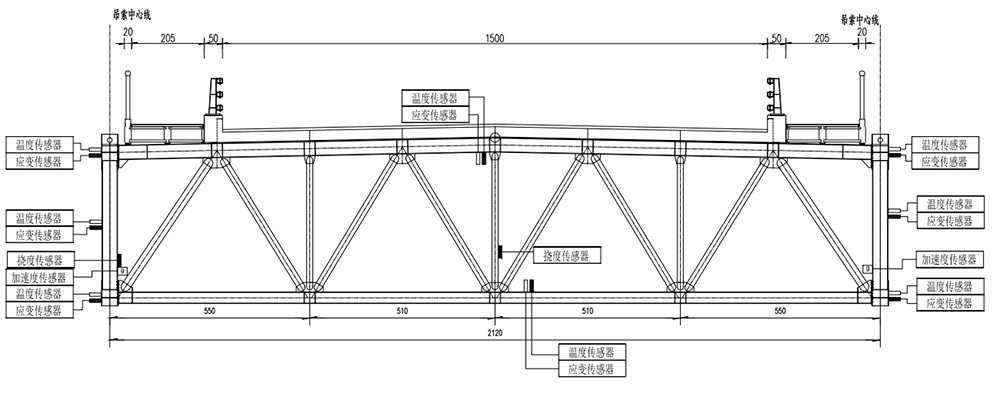
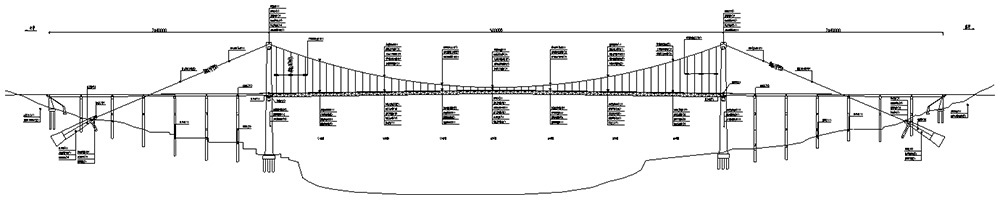
Figure 3.1 Monitoring schematic diagram
4.Basic Function
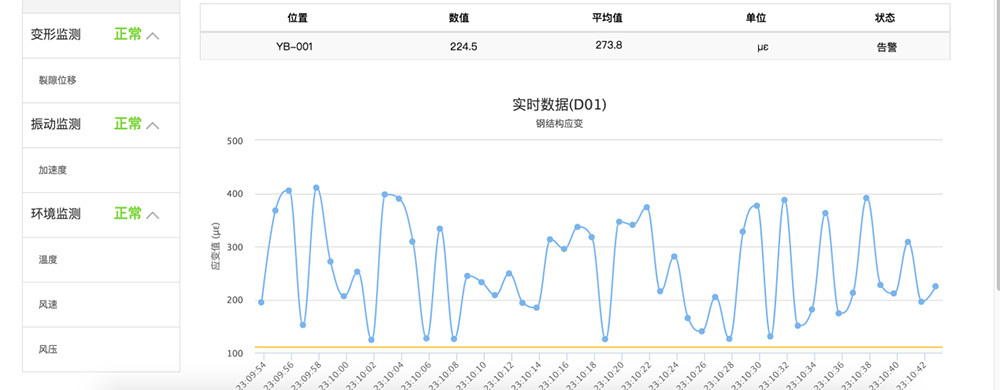
Figure 4.1 Real time data
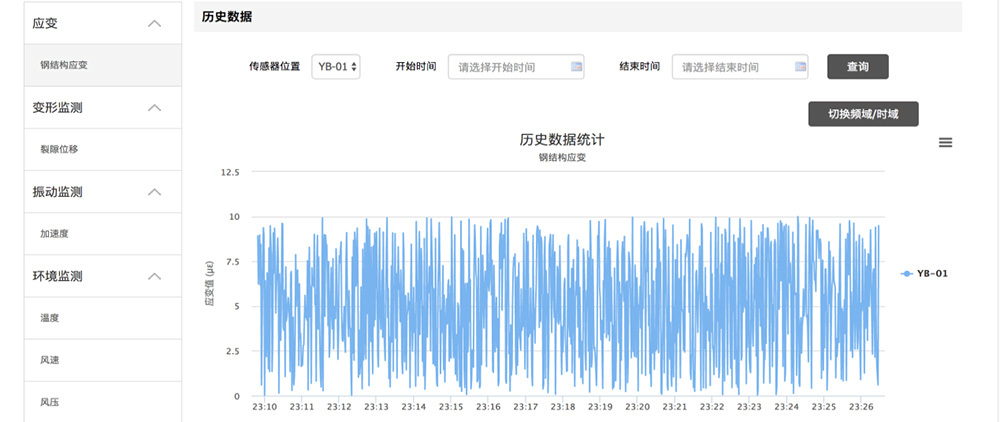
Figure 4.2 Historical Data
Related Plans


Official Account

Chongqing Baian Technology Co., Ltd
Company Address: 22-5, No. 11, Panxi Seventh Branch Road, Shimahe Street, Jiangbei District, Chongqing
Production address: 3rd floor, Building 2, Gangcheng Science and Technology Innovation Park, Haier Road, Jiangbei District, Chongqing
Tel:+86-4000672018 +86-023-67630927
E_mail:cqbakj@yeah.net